

What Our Innovate UK Project Is Helping Us Build
A single inspection tells you how a blade looks today. The more useful question for an operator is how it’s changing. Is that erosion spreading? Has last year’s crack grown? Is the blade you repaired two seasons ago holding up?
Answering those questions depends on something less visible than the drone or the AI: how inspection data is connected over time. It’s been one of the research strands in our Innovate UK project, and it’s quieter than most of what we work on.
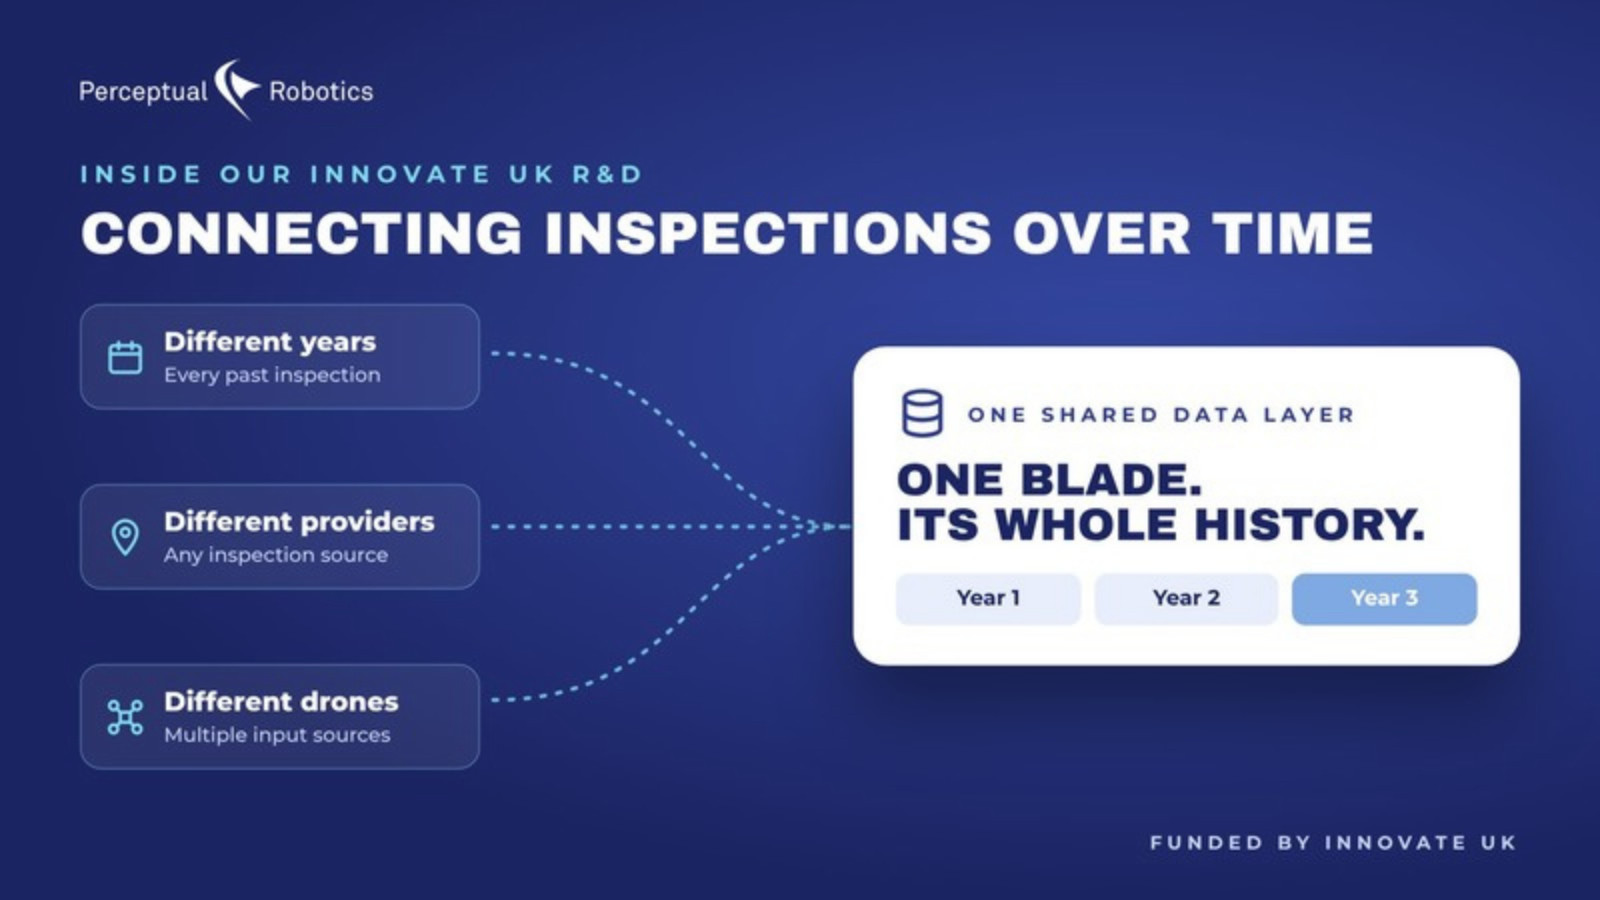
Over the summer our Digital Insights team built a revamped shared home for a turbine’s inspection history, so every inspection, finding and record for a blade sits in one place rather than scattered across years, sites and drones. The first portal pages already run on it, and when a customer sets up a wind farm, that information writes straight into the same picture.
Since September, you can link a finding to the same damage in an earlier inspection with a single click, right where you review the images. Before, that meant opening a separate tool and matching things up by hand. Now the history travels with the blade.
It’s foundational work and rarely makes headlines. But it’s what turns inspection data from ‘what’s wrong today?’ into ‘what’s changing, and what should we fix first?’
Next, we’re bringing more types of inspection data into the same picture, including from inside the blade.
This project is funded by Innovate UK.